Anatomy and Physiology: ECG: Measuring a Beat
ECG: Measuring a Beat
The electrical conductivity that is an inherent part of the intrinsic conducting system of the heart allows the details of a heartbeat to be measured in great detail. This measurement, which is called an electrocardiogram, or ECG (it is sometimes called an EKG in order to separate it from the similar sounding EEG or electroencephalogram; see The Central and Peripheral Nervous Systems), is done by attaching numerous electric leads to the patient and measuring the voltage changes as a result of nerve impulses within the intrinsic conducting system.
There are three basic waves involved in an ECG tracing (see Figure 11.5): the P wave, the QRS complex, and the final T wave. The P wave is a gentle curve that indicates the depolarization of the atria. You may remember from The Structure of the Muscles and Muscle Cells that depolarization is the start of the stimulus that initiates a muscle contraction, in this case the contraction of the atria. In order for the atria to contract, the cell membranes must repolarize prior to the next contraction.
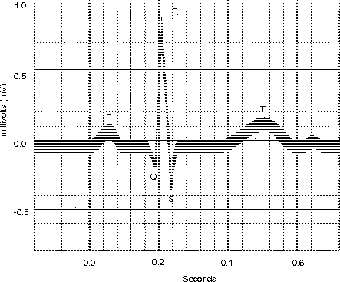
Figure 11.5The different portions of the ECG curve—PQRST—are used to illustrate atrial and ventricular depolarization and repolarization. (LifeART©1989-2001, Lippincott Williams & Wilkins)
The repolarization of the atria is extremely small, and it is hidden by the sharp tracing of the depolarization of the much larger ventricles in the QRS complex. The sharp, angular nature of the curve explains the use of three letters, which are needed to map out the three parts of the inverted V shape. The last part of an ECG is the T wave, which looks similar to the P wave, but in this case illustrates ventricular repolarization.
The spacing of the intervals, not to mention the timing between successive PQRST cycles, says a lot about how the heart is functioning. A longer P-R interval could mean damage to either the conducting pathways or the AV node, or a long Q-T interval could indicate the presence of a dangerous congenital heart defect that could lead to sudden death.
The Cardiac Cycle
The cardiac cycle refers to the events in the heart not only during a heartbeat, but also during the full period between the start of one heartbeat and the start of the next beat. As you have seen earlier, in a cardiac version of “reading between the lines,” diastole is just as important as systole. Numerous things are measured in a typical cardiac cycle (see Figure 11.6): (1) ECG, (2) heart sounds, (3) pressures in the atria, ventricles, pulmonary trunk, and aorta, and (4) left ventricular volume.
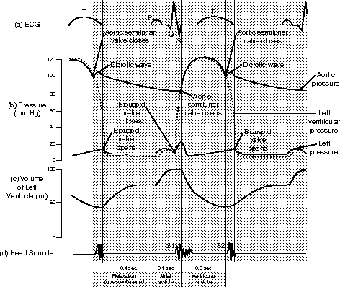
Figure 11.6The phases of the cardiac cycle, showing the relationship between atrial and ventricular systole and diastole.
At the end of atrial systole the ventricles hold the maximum amount of blood. This maximum ventricular volume, a surprising small 130 milliliters for an average person at rest, is called the EDV, or end-diastolic volume. In the same sense, the smaller volume of ventricular systole, about 50 milliliters (the heart never fully empties), is called the end-systolic volume (ESV).
So how much does your heart actually pump? Well, a single beat of the heart pumps blood out of the ventricles, and you have the before and after volumes already! The full ventricle—end-diastolic volume (EDV)—holds 130 milliliters, and an “empty” ventricle—end-systolic volume (ESV)—holds 50 milliliters, so the amount ejected, or stroke volume (SV), is easy:
Flex Your Muscles
All this talk about systole and diastole will come in handy when you learn about blood pressure (see Cardiovascular and Lymphatic Circulation). The pressure in the arteries as a result of systole in the left ventricle is the systolic pressure, which is understandably higher than the diastolic pressure from left ventricular diastole.
- EDV-ESV = stroke volume (SV), or 130 ml- 50 ml = 80 ml
That's not much per ventricle and per beat, but it adds up! Don't forget that sometimes the heart beats faster (bpm = beats per minute)! The heart rate (HR) times the stroke volume gives you your cardiac output (CO) for one minute: HR × SV = CO. You might remember the amount of blood you have from The Blood: females—4 to 5 liters, males—5 to 6 liters. Let's see how much of it you pump in a minute:
- CO = (SV) 80 ml × (HR) 75 bpm = 6000 ml/min = 6 liters/min!
That's not much time for a round trip!
During ventricular systole, there is a period called isovolumetric contraction, during which the pressure in the ventricle rises while the valves remain closed. Have you ever tried to open a door when someone else was holding it closed on the other side? In order to open the door, you have to be able to push harder than the person on the other side, as you two play a kind of reverse tug-of-war.
Remember that the blood in the vessels is exerting a pressure on the vessel walls, not to mention the semilunar valves! The ventricles can pump the blood out only if the pressure that builds during the isovolumetric contraction exceeds that on the other side of the semilunar valves; at that point the aptly named ventricular ejection happens. For this reason, high blood pressure puts a strain on the left ventricle, for it must pump harder to force the blood through the aortic semilunar valve. To do this the ventricle increases in size; this increase, called left ventricular hypertrophy, ultimately weakens the heart and can lead to cardiac arrest.
Following ventricular systole, with the end-systolic volume, the ventricles start to relax, but the pressure in the ventricles exceeds that in the atria. The tug-of-war occurs at both ends of the ventricles! During this period the elasticity of the heart allows the ventricle to return to its original shape as it relaxes, in a period called isovolumetric relaxation.
Once again, when atrial systole exceeds the ventricular pressure, blood forces its way through the AV valves, and the cycle continues, on and on, for about 2,739,375,000 cycles, give or take several hundred thousand, depending on how long your heart continues to pump. Remember, after all, that ultimately everyone dies of heart failure (which makes cardiac arrest a worthless diagnosis of cause of death)! So keep on pumping!
Excerpted from The Complete Idiot's Guide to Anatomy and Physiology © 2004 by Michael J. Vieira Lazaroff. All rights reserved including the right of reproduction in whole or in part in any form. Used by arrangement with Alpha Books, a member of Penguin Group (USA) Inc.
To order this book direct from the publisher, visit the Penguin USA website or call 1-800-253-6476. You can also purchase this book at Amazon.com and Barnes & Noble.
Trending
Here are the facts and trivia that people are buzzing about.


