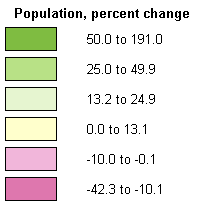
Oregon: Population, percent change, 1990 to 2000

Morrow County: 44.2Union County: 3.9Tillamook County: 12.5Gilliam County: 11.5Washington County: 42.9Crook County: 35.9Multnomah County: 13.1Malheur County: 21.4Sherman County: 0.8Deschutes County: 53.9Hood River County: 20.8Lane County: 14.2Harney County: 7.8Wasco County: 9.7Douglas County: 6.1Clackamas County: 21.4Coos County: 4.2Klamath County: 10.5Lake County: 3.3Curry County: 9.4Yamhill County: 29.7Marion County: 24.7Baker County: 9.3Clatsop County: 7.0Polk County: 25.9Columbia County: 16.0Jackson County: 23.8Lincoln County: 14.4Wallowa County: 4.6Umatilla County: 19.1Josephine County: 20.9Wheeler County: 10.8Grant County: 1.0Josephine County: 20.9Jefferson County: 39.0Linn County: 13.0Benton County: 10.4 Population, percent change, 1990 to 2000legend

Source information

Old URL
.com/us/census/maps/oregon/population-percent-change-1990-to-2000.html