Algebra: Solving Rational Inequalities
Solving Rational Inequalities
At the end of Quadratic Equations and Inequalities, I showed you how to solve and graph one-variable quadratic inequalities. Do you remember the process? Basically, you factored the quadratic, found critical numbers, split the number line into intervals based on those critical numbers, and then tested those intervals to see which were solutions of the inequality.
You'll use a very similar process to solve rational inequalities. Actually, to be perfectly honest, the process is exactly the sameI just didn't give you a completely accurate definition of what a critical number was back then. It's not that I didn't want to tell you; I've just found that algebra students work best on a "need to know" basis. You really didn't need to know the full definition in Quadratic Equations and Inequalities, but to solve rational inequalities, you do.
Talk the Talk
A critical number either causes a function to equal 0 or makes it undefined.
I already mentioned that a critical number is an x value that makes an expression equal 0. However, there's another way that values earn the classification of "critical number," when they cause the function to be undefined.
If you follow these steps, solving rational inequalities is a piece of cake:
- Rearrange the inequality so that only 0 remains on the right side. This means you should add and subtract terms from both sides to get everything moved to the left.
- Create one fraction on the left side, if necessary. Use common denominators to combine any terms into one single fraction.
- Factor the numerator and denominator. This makes finding critical numbers extremely easy.
- Set each factor in the numerator equal to 0 and solve. Mark these critical numbers on the number line using an open dot (if the inequality symbol is ) or a closed dot (if the inequality symbol is ¤ or ¥).
- Set each factor in the denominator equal to 0 and solve. These, too, are critical numbers, but should always be marked with an open dot on the number line, since they represent the values that cause the rational function to be undefined. (Remember, a 0 in the denominator is bad news, since dividing by 0 is illegal.)
- Choose test points to find solution intervals. Once you've found the critical numbers, the process is identical to the steps you followed in Quadratic Equations and Inequalities.
Be extra careful with the dots you place on the number line. If you use the wrong dot, you'll get the inequality signs in your final answer wrong, not to mention that the graph will be inaccurate as well.
Example 5: Solve the inequality and graph its solution.
Solution: Start by moving that -x to the left side of the inequality by adding x to both sidesthe right side has to be completely clear of any terms except 0.
Your goal now is to create only one fraction on the left side of the inequality by adding everything together. The least common denominator of those two terms is x + 4, so multiply the newly relocated x1 term's numerator and denominator by that value and combine the fractions.
Factor the numerator.
Set each factor of the numerator equal to 0 and solve to get two critical numbers.
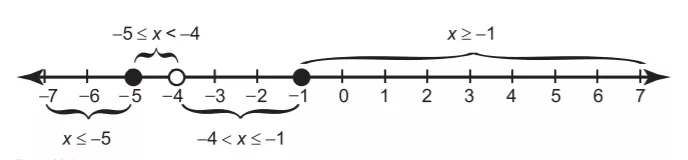
Figure 18.4The critical points, appropriately marked on the number line.

Figure 18.5The graph of the solution to 2x + 5x + 4 ¥ -x.
- x + 1 = 0 or x + 5 = 0
- x = -1 or x = -5
You've Got Problems
Problem 5: Solve and graph the inequality x + 7x - 2
You should mark both x = -1 and x = -5 on the number line with solid dots, since the inequality sign ¥ allows for equality, as shown in Figure 18.4. The final critical number is generated by setting the denominator's factor equal to 0.
- x + 4 = 0
- x = -4
Remember to use an open dot for x = -4, since its value comes from the denominator.
Now choose test points from each interval (I suggest x = -6, x = -4.5, x = -2, and x = 0). Both x = -4.5 and x = 0 make the inequality true, so their intervals make up the solution: -5 ¤x x ¥-1. Darken those intervals on the number line to make the graph, shown in Figure 18.5

Excerpted from The Complete Idiot's Guide to Algebra © 2004 by W. Michael Kelley. All rights reserved including the right of reproduction in whole or in part in any form. Used by arrangement with Alpha Books, a member of Penguin Group (USA) Inc.
You can purchase this book at Amazon.com and Barnes & Noble.
Trending
Here are the facts and trivia that people are buzzing about.


