Supply, Demand, and the Invisible Hand: Demand: Wants, Needs, and Red Meat
Demand: Wants, Needs, and Red Meat
In a market economy, everything has a price, and buyers—those with the demand—always want the price to be lower. Meanwhile, sellers—those with the supply—want the price to be higher.
In general, the lower the price of a given product or service, the greater the quantity people will be willing to buy. The higher the price of the product or service, the lower the quantity that people will be willing to buy. People buy more hamburgers than caviar, more costume jewelry than diamonds, more Chevrolets than BMWs.
Let's assume that a large supermarket chain sells beef (a fairly safe assumption). Let's further assume that it has experimented with various prices and has gathered the following data, here arranged into what economists call a demand schedule.
| Price per pound | Pounds of beef sold |
|---|---|
| 5.00 | 20,000 |
| 4.00 | 40,000 |
| 3.00 | 60,000 |
| 2.00 | 80,000 |
| 1.00 | 100,000 |
EconoTalk
A demand schedule shows the quantity of a product that people will buy (or demand) at a series of specific prices. A demand curve shows the same information in graphic form.
The demand schedule shows the quantity of a product that people will buy (demand) at a series of specific prices. Holding all other things equal, the lower the price, the greater the quantity of beef people will buy. Conversely, the higher the price, the lower the quantity of beef people will buy.
I emphasize “holding all other things equal” for two reasons:
First, we are assuming that the price of beef is rising or falling and that the prices of all other goods are not. That is, we are assuming that the price of beef is rising or falling relative to the price of other goods. We make this assumption because if, say, the price of chicken were rising or falling, this might not be the demand schedule for beef. (I'll explain why in a moment.)
Second, we are assuming that no factors other than price are affecting demand. There have been no reports of Mad Cow disease in Kansas, which would surely lower demand for beef. There are no new scientific studies telling us to eat more beef because it is rich in iron and makes us healthier, which would increase demand. Assuming that all other things remain equal may be unrealistic (actually, it is unrealistic), but it lets us analyze the effect of price on demand.
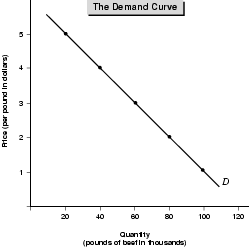
If we plot the data—prices and quantities—from the demand schedule on a chart, we get a picture of the demand for beef as shown in Figure 4.1. The demand curve slopes downward because as the price increases, the quantity of beef demanded decreases. A downward sloping demand curve holds true for most—but not all—types of products and services. There's an inverse relationship between price and demand: The higher the price, the lower the quantity demanded. The lower the price, the higher the quantity demanded.
It may seem obvious that people will buy more of a product when the price decreases and less when the price increases. However, they do so for two reasons. First, many people who never buy a product because it is too expensive will buy it if the price falls far enough. For instance, many seafood lovers never buy lobster because it's just out of their price range. If the price of lobster fell substantially, they would start buying it. Second, many people who already buy a product will buy more of it if the price decreases. If the price of lobster fell substantially, lobster lovers would buy it more often.
Excerpted from The Complete Idiot's Guide to Economics © 2003 by Tom Gorman. All rights reserved including the right of reproduction in whole or in part in any form. Used by arrangement with Alpha Books, a member of Penguin Group (USA) Inc.
To order this book direct from the publisher, visit the Penguin USA website or call 1-800-253-6476. You can also purchase this book at Amazon.com and Barnes & Noble.
Trending
Here are the facts and trivia that people are buzzing about.


