Supply, Demand, and the Invisible Hand: Back to the Curve
Back to the Curve
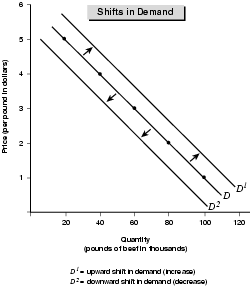
A change in overall demand represents a shift in demand, upward or downward. That means that one or more of the factors I just discussed can cause the entire demand curve to shift to the right (upward) or to the left (downward), as shown in Figure 4.2.
A shift in demand is different from a change in the quantity demanded because of a change in the price. If the supermarket chain lowers the price of beef from $4 to $3 and sees its sales increase from 40,000 to 60,000 pounds, the price change caused a change in the quantity demanded. That change represents movement along the demand curve, that is, along the curve D, the middle curve of the three curves in Figure 4.2.
A shift in demand occurs when the whole relationship between price and quantity changes. The new demand schedule provides the values that correspond to all three demand curves in Figure 4.2.
| Old Demand Schedule (D) | New Higher Demand Schedule (D1) | New Lower Demand Schedule (D2) | |
|---|---|---|---|
| Price per pound | Pounds of beef | Pounds of beef | Pounds of beef |
| 5.00 | 20,000 | 30,000 | 10,000 |
| 4.00 | 40,000 | 50,000 | 30,000 |
| 3.00 | 60,000 | 70,000 | 50,000 |
| 2.00 | 80,000 | 90,000 | 70,000 |
| 1.00 | 100,000 | 110,000 | 90,000 |
The whole relationship between price and quantity changes when a shift in demand occurs. For example, the new, higher demand curve shows that at the $3 price, people will now buy 70,000 pounds of beef. Perhaps the price of chicken has increased to the point where people figure they may as well buy beef. Or maybe incomes in the region have increased to the point where people now have more money to spend on beef. If that's the case, at the $3 price—and at any price along the new demand curve—they will buy more of it.
Similarly, along the new, lower demand curve, people collectively will buy only 50,000, rather than 60,000, pounds of beef at $3. This type of shift also usually occurs for one of the reasons I just discussed. For instance, the price of chicken may have fallen sharply or people's incomes may have decreased due to layoffs in the region.
As I mentioned at the start of this section, when there is demand for a product in a market economy someone will supply it. Let's move to the other side of the transaction and examine the dynamics of supply.
Excerpted from The Complete Idiot's Guide to Economics © 2003 by Tom Gorman. All rights reserved including the right of reproduction in whole or in part in any form. Used by arrangement with Alpha Books, a member of Penguin Group (USA) Inc.
To order this book direct from the publisher, visit the Penguin USA website or call 1-800-253-6476. You can also purchase this book at Amazon.com and Barnes & Noble.
Trending
Here are the facts and trivia that people are buzzing about.


